
A new map revealing the UK’s most dangerous roads has been produced using fatality data gathered by the Department of Transport and the Police Service of Northern Ireland over a five-year period.
The map identifies the most high-risk highways and is intended to help fleet operators to manage potential hazards, said its producer, telematics firm Teletrac Navman.
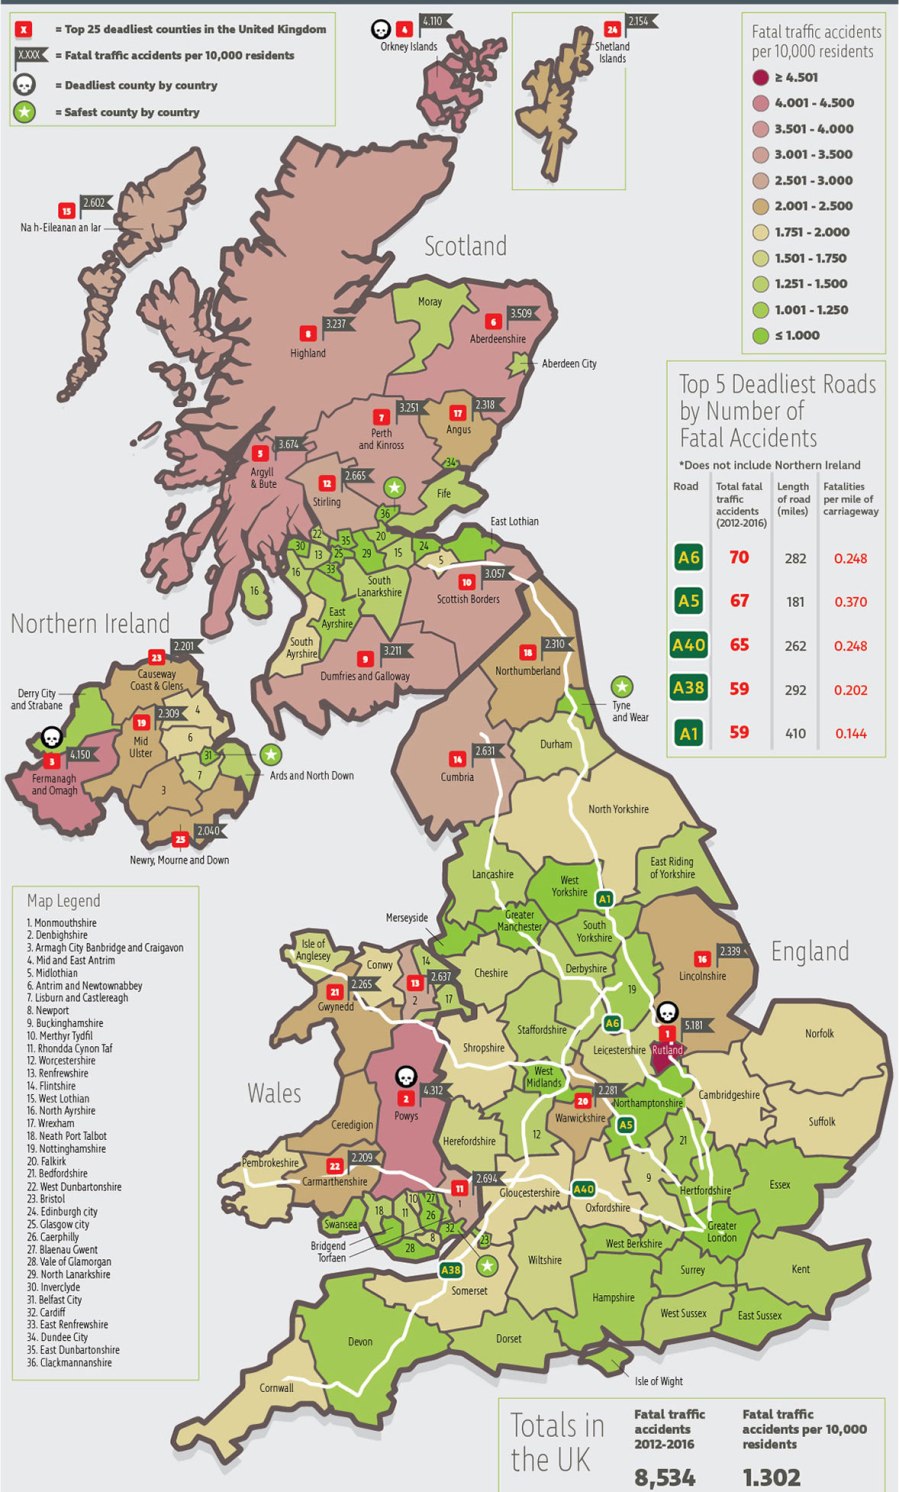
Between 2012 and 2016, a total of 8534 fatal traffic accidents were recorded across some of the busiest roads in the UK. In the same period, the A6 between Luton and Cumbria topped the list of Britain’s most deadly stretches, with 70 fatalities.
The A5 connecting London to Holyhead was found to be the second most hazardous road with 67 fatal accidents, with the A40 from London to Fishguard close behind with 65 fatalities.
The new map also highlights the deadliest county by country; Rutland in England’s East Midlands had the nation’s highest rate of fatal traffic accidents, with 5.181 per 10,000 residents, followed by Powys in Wales (4.312), Fermanagh & Omagh in Northern Ireland (4.150) and the Orkney Islands in Scotland (4.110).
Meanwhile, Scotland’s smallest county, Clackmannanshire, was the safest area and recorded no fatalities during 2012 and 2016. Cardiff, Tyne and Wear and Belfast City had the next lowest rates per 10,000 residents.
“When operating a fleet, driver safety is extremely high on the agenda,” said Peter Millichap, UK marketing director at Teletrac Navman. “As such, knowing which stretches of road are the most dangerous can help operators reduce the risk of accidents by adjusting their routes or schedules accordingly.
“This informative map, together with today’s telematics technology, provides fleet operators with greater visibility and access to powerful fleet management tools that go a long way toward monitoring its safety and efficiency on the road.”